
EQ Saddle Science - Disc Pressure Analysis
Testing Sorbothane Disc Pressure Distribution
Preliminary results of research conducted by Michigan State University using state-of-the-art Novel Pliance pressure testing system in a study designed and conducted by Dr. Jane Manfredi, DVM, MS, PhD, DACVS-LA, DACVSMR (Equine)

The EQ Saddle Science Design
EQ Saddle Science uses the innovative EQFlex™ panel system with four shock-absorbing Sorbothane™ discs. The EQFlex™ panels are comprised of acetyl resin material sandwiched between high-tech foams and sheathed in leather. The panels move independently with the horse, while the discs provide shock absorption between the rigid saddle tree and the flexible panels.
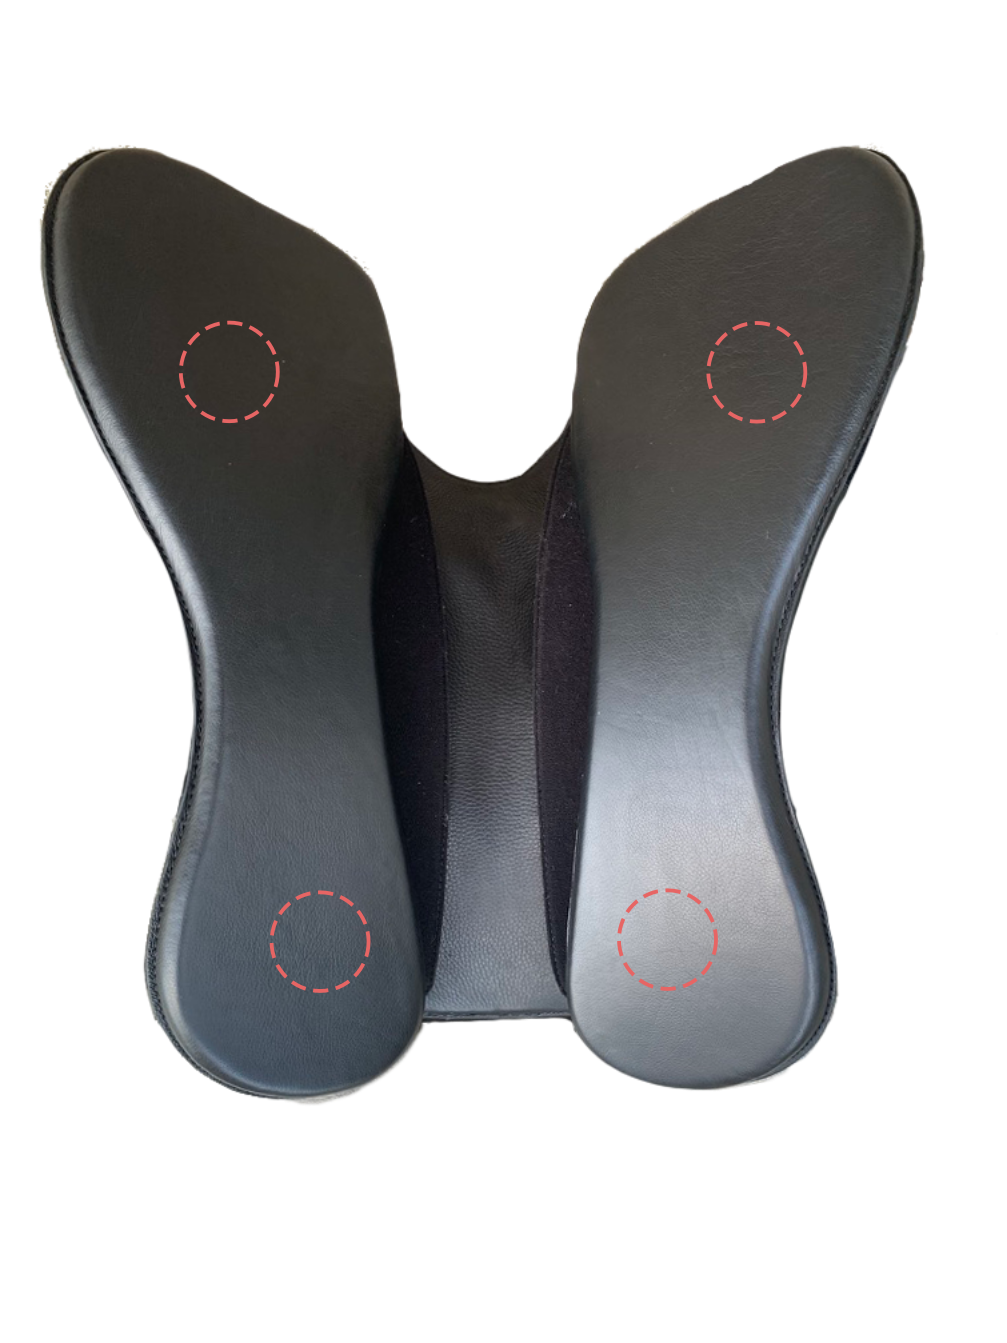
Underside view of EQ Saddle EQFlex™ panels (pommel at top). Dotted red circles show the four Sorbothane™ disc positions (2.5" diameter) connecting the saddle tree to the EQFlex™ panels.
How the EQFlex™ Panel System Works
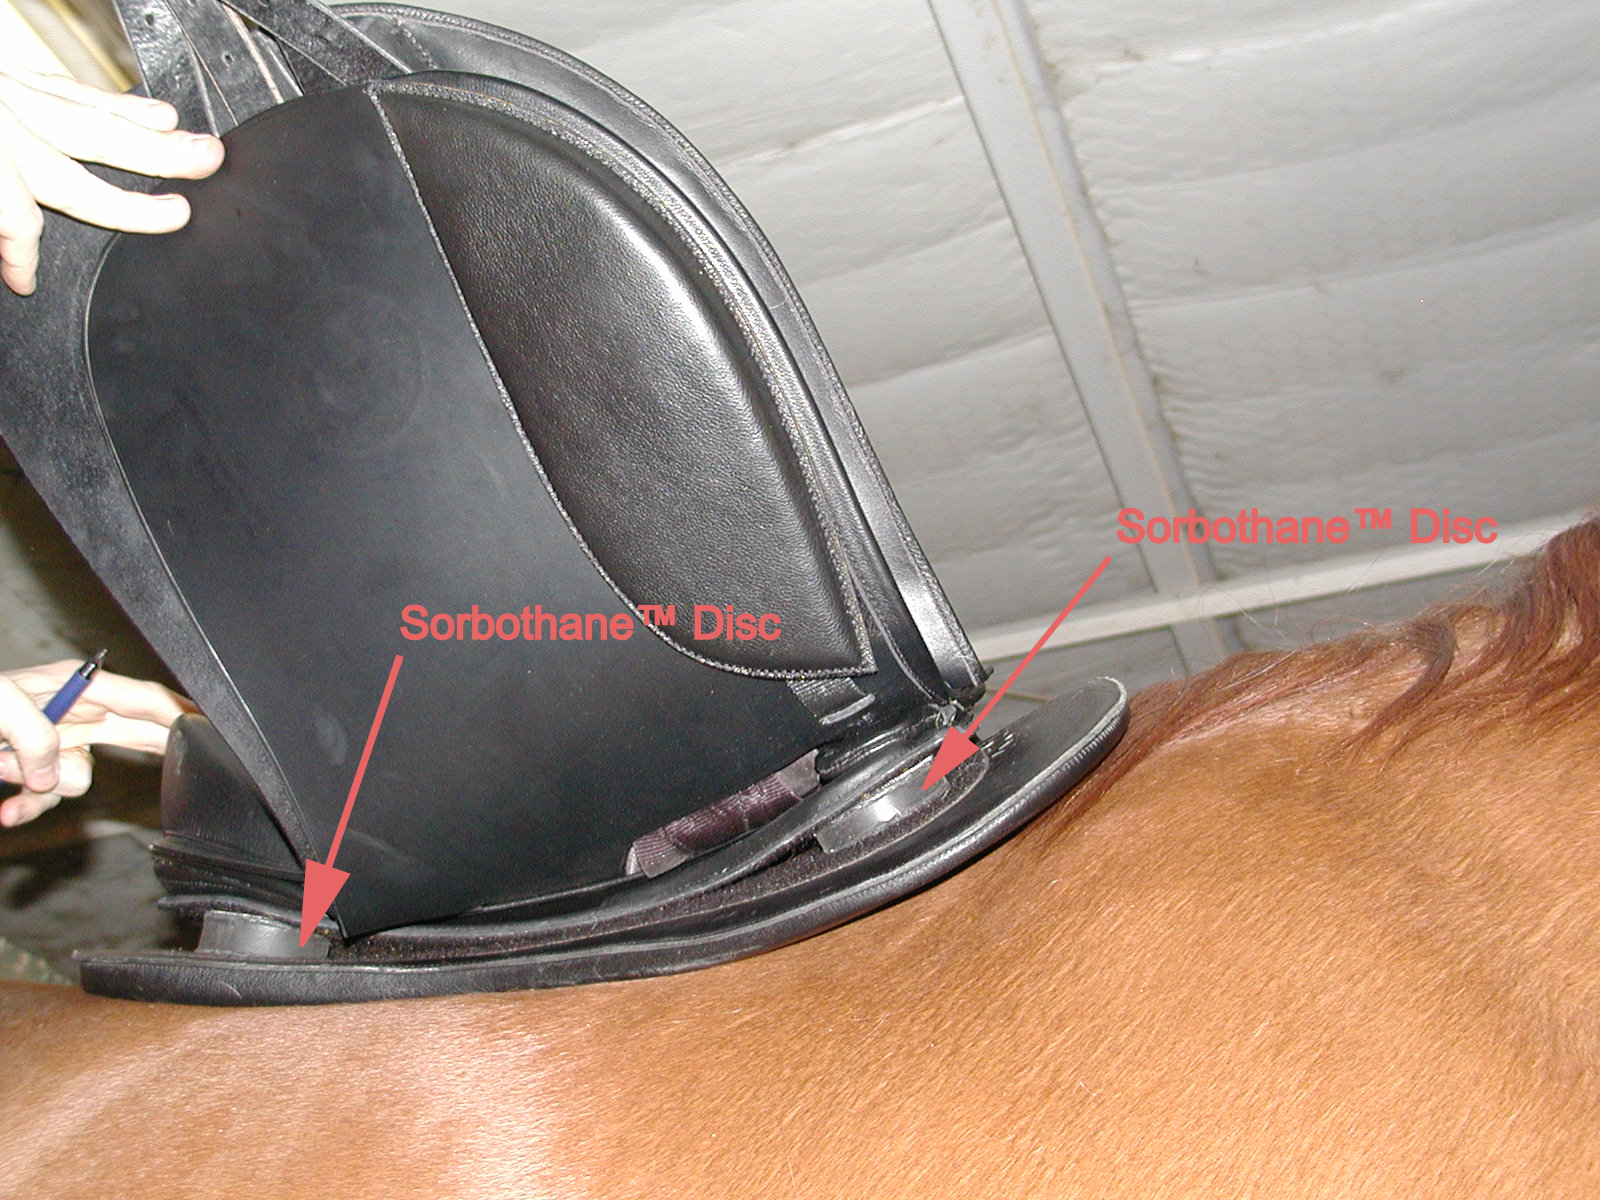
Side view showing the EQFlex™ panel conforming to the horse's back. The Sorbothane™ discs provide shock absorption while creating critical gaps between the panels and the tree, which allows the panels to flex, while the vast majority of the rider's weight is distributed directly onto the panel area between the discs. The front and rear panel areas flex to allow free movement of the horse's scapula and swing through the back.
The Question: Do the Discs Create Pressure Points?
Some riders worry that the four connection discs might create concentrated pressure points that could cause discomfort or tissue damage. We set up a test to determine whether these discs create problematic pressure concentrations.
The concern: Even though the discs are designed to absorb shock, could they inadvertently create "hot spots" of pressure where they connect the saddle to the panels?
Our Testing Method
-
Equipment: Novel Pliance equine pressure mat
Sensors: 16×16 grid (256 total sensors)
Sampling: 60 Hz (60 readings per second)
Gait tested: Sitting trot
This high-frequency recording captures the dynamic pressure changes as the horse moves through gait phases.
-
We average all pressure readings over the entire recording to identify persistent pressure patterns.
Why average? This eliminates transient spikes from irregular movements and reveals the consistent pressure distribution that could cause tissue damage.Result: One 16×16 averaged pressure map showing where pressure consistently occurs.
-
We use bilinear interpolation to increase the resolution from 16×16 to 80×80 pixels.
Why interpolate? The higher resolution allows us to detect smaller, more localized pressure patterns that might be missed in the coarser grid.
This smoothing technique creates a more detailed pressure map while preserving the actual measured values at sensor locations.
-
We divide the pressure map into four quadrants (one per disc) and perform a convolutional analysis.
What is convolution? We slide a virtual disc across the pressure map and calculate the average pressure that would be under the disc at each position. The location with the highest average pressure is the convolution peak. If the actual disc was causing a pressure point, we'd find the highest average right at the disc's location.
Key insight: If discs create pressure points, we'll find convolution peaks at the disc locations (origin). If peaks are elsewhere, pressure is distributed by other factors.
Understanding Convolutional Analysis
Here we show the complete convolutional analysis results from a horse in sitting trot:
See the Analysis in Action
A virtual circle, sized to represent the Sorbothane™ disc, moves across the pressure map and evaluates the average pressure at each position. The location with the highest average pressure is the convolution peak.
The red circle scans across the measured pressure field, searching for the location with the greatest average pressure.
We slide a virtual disc across the pressure map and calculate the average pressure that would be under the disc at each position. The location with the highest average pressure is the convolution peak. If the actual disc was causing a pressure point, we'd find the highest average right at the disc's location. Watch the animation to see this process:
Example Analysis
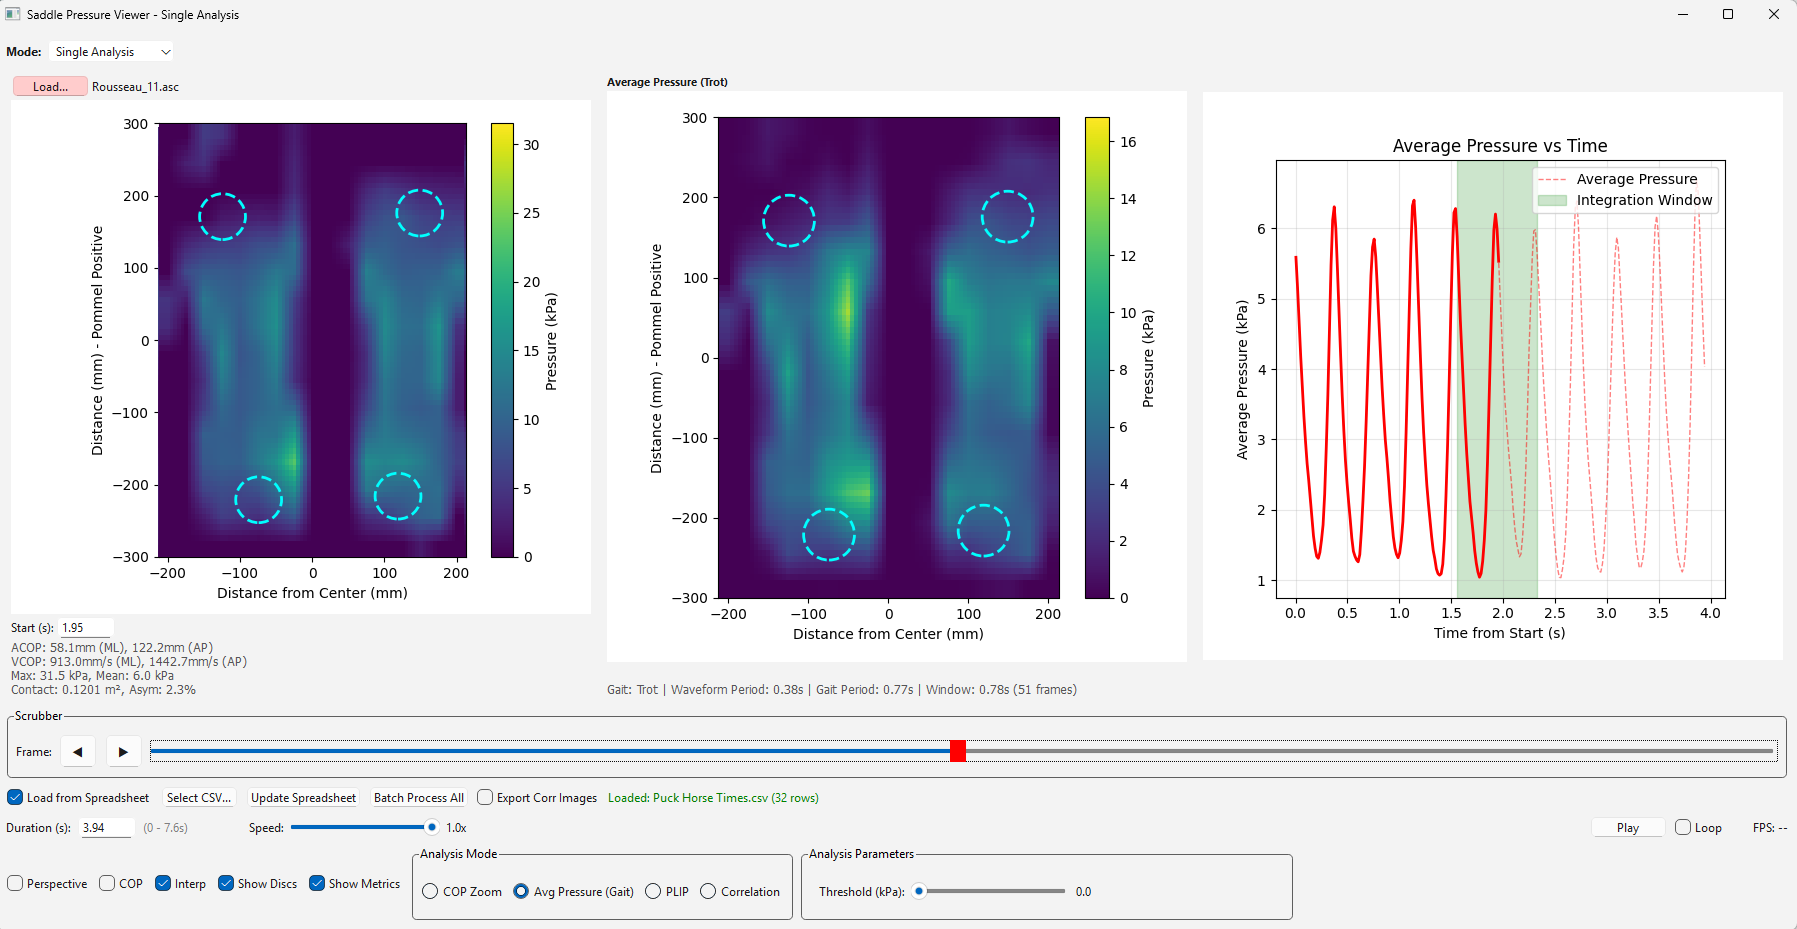
Interpolated Average Pressure Map (Sitting Trot)
Center panel shows the time-averaged, interpolated pressure distribution. White dashed circles indicate the four disc locations. Notice how the high pressure zones (green/yellow) are distributed across the panels, and not at the disc positions.
Convolution Analysis Results
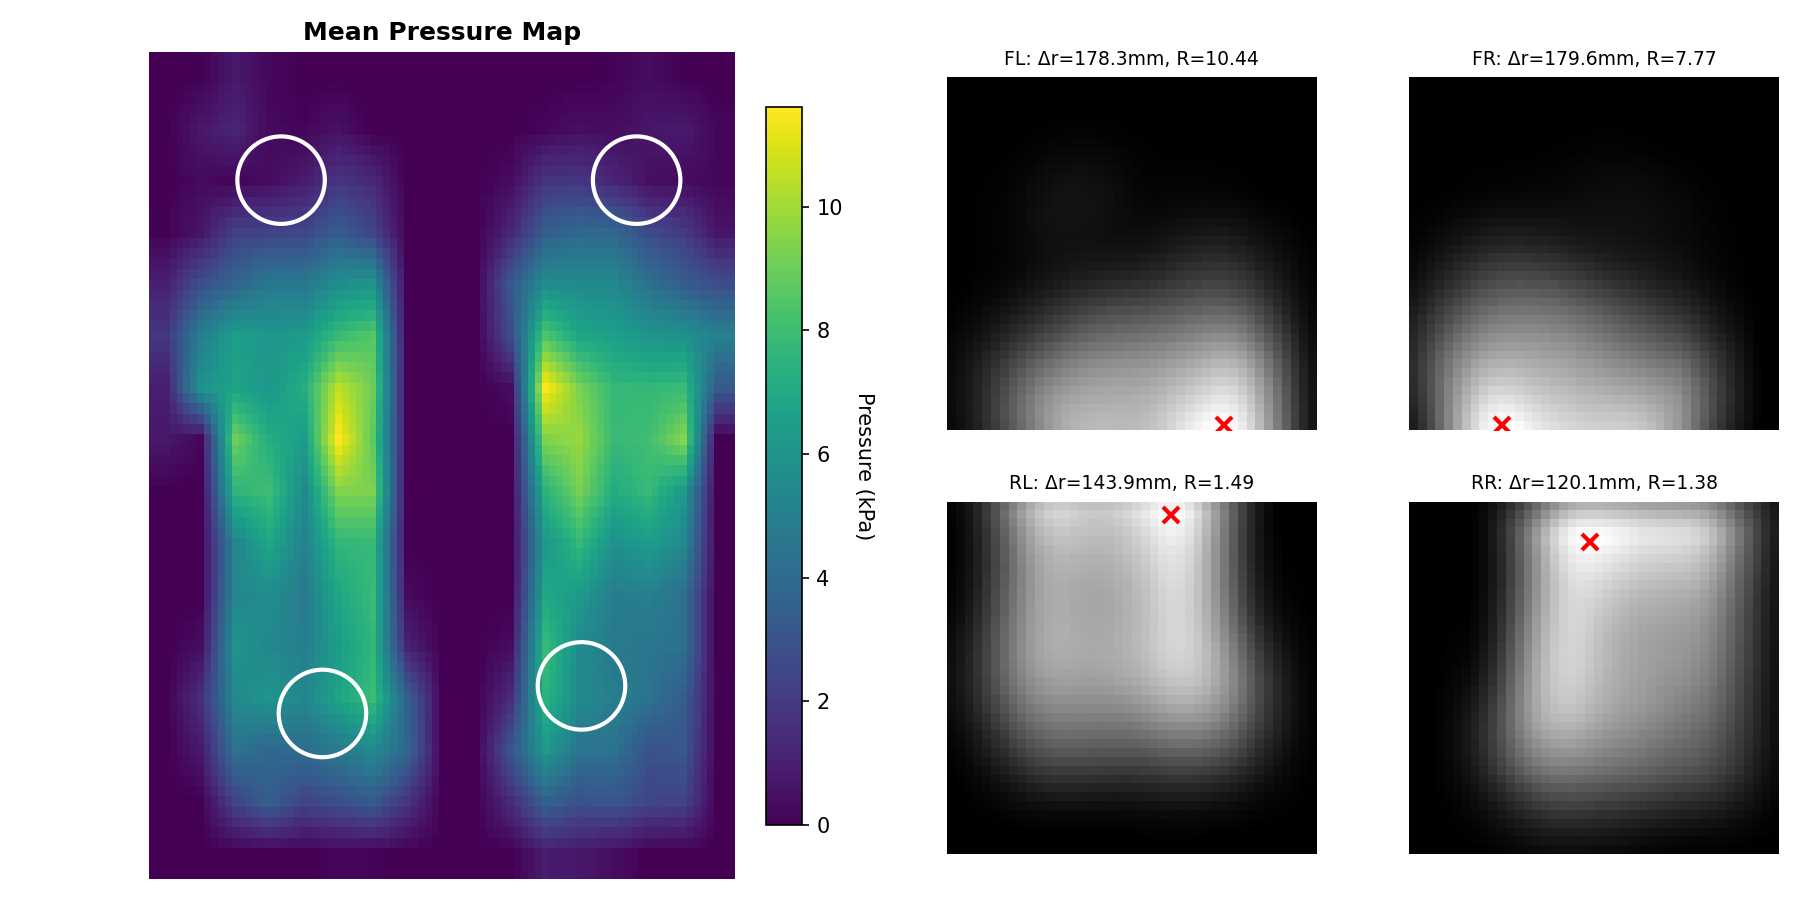
Pressure maps for each disc quadrant. The green circles show the actual disc positions (63.5mm diameter) at the center of each quadrant. The red X marks show where the pressure peaks actually occur - all significantly displaced from the disc centers:
Top Left (FL)
Δr = 178.3mm (Ratio: 10.44)
Top Right (FR)
Δr = 179.6mm (Ratio: 7.77)
Botton Left (RR)
Δr = 120.1mm (Ratio: 1.38)
Bottom Left (RL)
Δr = 143.9mm (Ratio: 1.49)
📊
Ongoing Research
The example above represents one recording from our comprehensive research program. We are currently analyzing a large number of pressure recordings across:
Multiple horses with different conformation and sizes
Multiple riders with different weights and riding styles
Multiple gaits (walk, trot, canter) and transitions
Our results consistently show that the Sorbothane discs do not create pressure hotspots. We intend to publish our comprehensive findings in a peer-reviewed scientific journal.
Good News: No Pressure Points at Disc Locations!
In the sitting trot example shown above, ALL four convolution peaks were found far from the disc centers (distances ranging from 120-180mm). This conclusively demonstrates:
The Sorbothane discs are NOT creating pressure points
Pressure distribution is determined by the horse's anatomy and movement, not disc locations
The EQFlex™ panel system successfully distributes load across a wide area
The shock-absorption design works as intended without creating harmful pressure
The Results
What This Means for Riders
This 2025 MSU study confirms that EQ Saddle Science’s innovative design does not cause pressure points. The Sorbothane discs provide shock absorption while the EQFlex™ panels distribute pressure as well or often better than other types of saddle panels. Riders can choose EQ with confidence in the functionality of the design.
A prior study in 2016, yielded Dr. Hilary Clayton's research paper which proved that the EQ design is more stable for riders. The video below is from Dr. Clayton's study. It shows the same horse and rider in the extended trot in their own saddle vs. an EQ saddle; the moving line traces the rider's center of pressure during this sequence. The image on the left is the conventional saddle, and the image on the right is the EQ Flapless Dressage Saddle.